
Karthik Kambatla co-authored this post.
It is well-known that solid-state drives (SSDs) are fast and expensive. But exactly how much faster — and more expensive — are they than the hard disk drives (HDDs) they’re supposed to replace? And does anything change for big data?
I work on the performance engineering team at Cloudera, a data management vendor. It is my job to understand performance implications across customers and across evolving technology trends. The convergence of SSDs and big data does have the potential to broadly impact future data center architectures. When one of our hardware partners loaned us a number of SSDs with the mandate to “find something interesting,” we jumped on the opportunity. This post shares our findings.
As a starting point, we decided to focus on MapReduce. We chose MapReduce because it enjoys wide deployment across many industry verticals — even as other big data frameworks such as SQL-on-Hadoop, free text search, machine learning, and NoSQL gain prominence.
We considered two scenarios: first, when setting up a new cluster, we explored whether SSDs or HDDs, of equal aggregate bandwidth, are superior; second, we explored how cluster operators should configure SSDs, when upgrading an HDDs-only cluster.
SSDs vs HDDs of equal aggregate bandwidth
For our measurements, we used the storage configuration in the table below. The machines were Intel Xeon 2-socket, 8-core, 16-thread systems, with 10Gbps Ethernet and 48GB RAM.
| Setup | Storage | Capacity | Sequential R/W bandwidth | Price |
| HDD | 11 HDDs | 22 TB | 1300 MBps | $4,400 |
| SSD | 1 SSD | 1.3 TB | 1300 MBps | $14,000 |
A common but incomplete mental model assumes that MapReduce contains only large, sequential read and writes. MapReduce does exhibit large, sequential IO when reading input from and writing output to HDFS. The intermediate shuffle stage, in contrast, involves smaller read and writes. The output of each map task is partitioned across many reducers in the job, and each reduce task fetches only its own data. In our customer workloads, this led to each reduce task accessing as little as a few MBs from each map task.
By their physical design, SSDs avoid the large seek overhead of small, random IO for HDDs. SSDs do perform much better for shuffle-heavy MapReduce jobs. In the graph below, “terasort” is a common benchmark with 1:1:1 ratio between input:shuffle:output sizes; “shuffle” is a shuffle-only job that we wrote in-house to purposefully stress only the shuffle part of MapReduce. SSDs offer as much as 40% lower job duration, which translates to 70% higher performance.
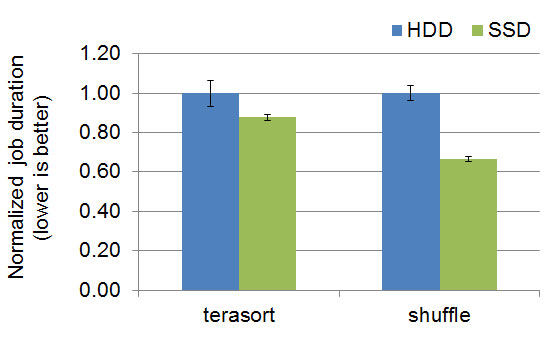
Graph courtesy of Yanpei Chen.
To our initial surprise, we learned that SSDs also benefit MapReduce jobs that involve only HDFS reads and writes, despite HDDs having the same aggregate sequential bandwidth according to hardware specs. In the graph below, “teragen” writes data to HDFS with three-fold replication, “teravalidate” reads the output of terasort and checks if they are in sorted order, and “hdfs data write” is a job we wrote in-house and writes data to HDFS with single-fold replication. SSDs again offer up to 40% lower job duration, equating to 70% higher performance.
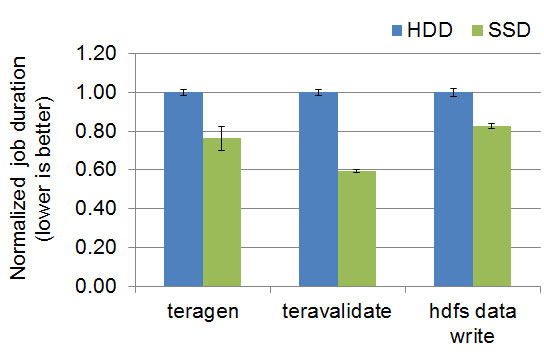
Graph courtesy of Yanpei Chen.
It turns out that our SSDs have an advantage for sequential workloads because they deliver higher sequential IO size — 2x larger than the HDDs in our test setup. To write the same amount of data, SSDs incur half the number of IOs. This difference may be a vendor-specific characteristic, as other SSDs or HDDs likely offer different default configurations for sequential IO sizes.
There is another kind of MapReduce job — one that is dominated by compute rather than IO. When the resource bottleneck is not the IO subsystem, the choice of storage media makes no difference. In the graph below, “wordcount” is a job that involves high CPU load parsing text and counting word frequencies; “shuffle compressed” is the shuffle-only job from earlier, except with MapReduce shuffle compression enabled. Enabling this configuration shifts load from IO to CPU. The advantage from SSDs decreases considerably compared with the uncompressed “shuffle” from earlier.
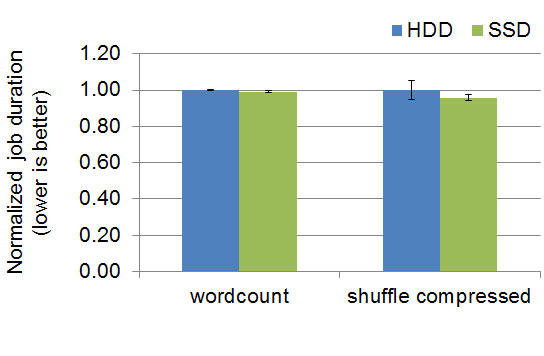
Graph courtesy of Yanpei Chen.
Ultimately, we learned that SSDs offer considerable performance benefit for some workloads, and at worst do no harm. The decision on whether to use SSDs would then depend on any premium cost to obtain higher performance. We’ll return to that discussion later.
Configuring a hybrid HDD-SSD cluster
Almost all existing MapReduce clusters use HDDs. There are two ways to introduce SSDs: 1) buy a new SSD-only cluster, or 2) add SSDs to existing HDD-only machines (some customers may prefer the latter option for cost and logistical reasons). Therefore, we found it meaningful to figure out a good way to configure a hybrid HDD-SSD cluster.
We setup clusters with the following storage configurations:
| Setup | Storage | Capacity | Sequential R/W bandwidth | Price |
| HDD-baseline | 6 HDDs | 12 TB | 720 MBps | $2,400 |
| HDD-11 | 11 HDDs | 22 TB | 1300 MBps | $4,400 |
| Hybrid | 6 HDDs + 1 SSD | 13.3 TB | 2020 MBps | $16,400 |
We started with a low-IO-bandwidth cluster of six HDDs. With default configurations, adding a single SSD leads to higher performance, about the same improvement we get by adding five HDDs. This is an undesirable result, because the single additional SSD has double the bandwidth than the additional five HDDs.
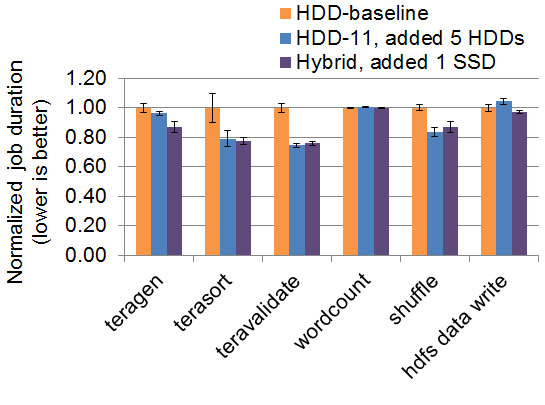
Graph courtesy of Yanpei Chen.
A closer look at HDFS and MapReduce implementations reveals a critical insight: both the HDFS DataNode and the MapReduce NodeManager write to local directories in a round-robin fashion. A typical setup would mount each piece of storage hardware as a separate directory, e.g., /mnt/disk-1, /mnt/disk-2, /mnt/ssd-1. With each of these directories mounted as a HDFS and MapReduce local directory, they each receive the same amount of data. Faster progress on the SSD does not accelerate slower progress on the HDDs.
So, to fully utilize the SSD, we need to split the SSD into multiple directories to maintain equal bandwidth per local directory. In our case, SSDs should be split into 10 directories. The SSDs would then receive 10x the data directed at each HDD, written at 10x the speed, and complete in the same amount of time. When the SSD capacity accommodates the 10x data size written, performance is much better than the default setup.
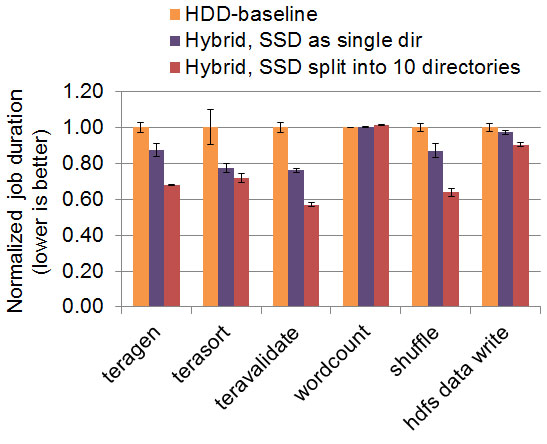
Graph courtesy of Yanpei Chen.
Price per performance vs price per capacity
We found that for our tests and hardware, SSDs delivered up to 70 percent higher performance, for 2.5x higher $-per-performance (average performance divided by cost). Each customer can decide whether the higher performance is worth the premium cost. This decision employs the $-per-performance metric, which differs from the $-per-capacity metric that storage vendors more frequently track. The SSDs we used hold a 50x premium for $-per-capacity — a gap far larger than the 2.5x premium for $-per-performance.
The primary benefit of SSD is high performance, rather than high capacity. Storage vendors and customers should also consider $-per-performance, and develop architectures to work-around capacity constraints.
The table below compares the $-per-performance and $-per-capacity between HDDs and SSDs. We also include some updated data we received from different hardware partners earlier this year. The $-per-performance gap is approaching parity even as the $-per-capacity gap remains wide.
| Setup | Unit cost | Capacity | Unit BW | US$ per TB | US$ per MBps |
| HDD circa 2013 | $400 | 2 TB | 120 MBps | 200 (2013 baseline) | 3.3 (2013 baseline) |
| SSD circa 2013 | $14,000 | 1.3 TB | 1300 MBps | 10,769 (54x 2013 baseline) | 10.8 (2.5x 2013 baseline) |
| HDD circa 2015 | $250 | 4 TB | 120 MBps | 62.5 (2015 baseline) | 2.1 (2015 baseline) |
| SSD circa 2015 | $6,400 | 2 TB | 2000 MBps | 3,200 (51x 2015 baseline) | 3.2 (1.5x 2015 baseline) |
SSD economics — exploring the trade-offs
Overall, SSD economics involve the interplay between ever-improving software and hardware as well as ever-evolving customer workloads. The precise trade-off between SSDs, HDDs, and memory deserves regular re-examination over time.
We encourage members of the community to extend our work and explore how SSDs benefit SQL-on-Hadoop, free text search, machine learning, NoSQL, and other big data frameworks.
More extended versions of this work appeared on the Cloudera Engineering Blog and at the Large Installation System Administration Conference (LISA) 2014.
Cropped image on article and category pages by Brian Reynolds on Flickr, used under a Creative Commons license.