
Report sections
In the previous two years, since the last State of the Computer Book Market posts, the Tech Book market has been going through some major changes. Hopefully you will see some of the trends that cause change, through the faint signals that the book market provides.
You can get a quick refresher on how we see Computer Book Sales as a Technology Trend Indicator and our other posts on the State of the Computer Book Market.
The data is from Bookscan‘s weekly top 3,000 titles sold. Bookscan measures actual cash register sales in bookstores. Simply put, whenever you buy a technology-oriented book in the United States, there’s a high probability it will get recorded in this data. Retailers such as Borders, Barnes & Noble, and Amazon make up the lion’s share of these sales.
There will be five posts in total, which will be delivered every other day in the next week:
- Post 1, Overall Market
- Post 2, Category Performance
- Post 3, Publisher/Imprint Performance
- Post 4, Programming Language Performance
- Post 5, Summary and Digital Sales
Overall Book Market Performance
Before we get to the specifics of the computer book market, let’s get some context by looking at the whole book market for the week ending January 2, 2011. Everything that is printed, bound, and sold as a book, from The Girl with the Dragon Tatoo and Eat, Pray, Love to Decision Points and The Ugly Truth is represented in the table below.
Overall Book Market – EVERYTHING -Week Ending: 2011-01-02
| All Books, All Subjects |
| Juvenile Non-Fiction | -0.44% |
| Juvenile Fiction | -3.46% |
| Total Juvenile | -2.88% |
| Adult Non-Fiction | -1.91% |
|       Computers and Internet | -3.99% |
| Adult Fiction | -7.20% |
| Other | -13.12% | Total Market | -4.54% |
As you can see, the computer market is down about 4% from last year. It should be noted that the computer book market makes up only about 1% of total unit sales in bookstores and online retailers. If you would like to see the performance of the major categories, this table shows percentage growth. I find it interesting that the Humor category is one of the largest-growing in an otherwise depressed market. The other growth area is Children’s Non-Fiction Education/Reference — and I certainly wonder why this category in particular is experiencing such strong growth.
Now on to the tech book market. The chart below gives some perspective into how each year stacks up against prior years. As you can see, there has been some serious erosion since 2007, our most recent high point. The sales in 2007 had many believing that the market was finally recovering from the post-2001 decline, but then 2009 showed the biggest drop from a prior year.

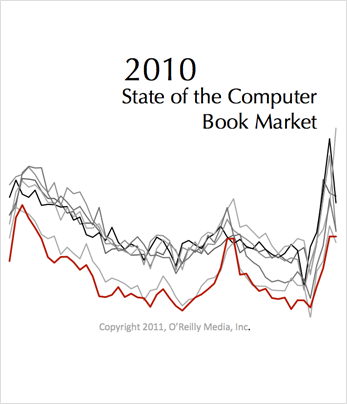
Immediately below is the weekly trend for the entire computer book market since 2004, when we first obtained reliable data from Bookscan. Please remember that the data represents all publishers, and not just O’Reilly. The slightly thicker red line represents the 2010 data.

As you can see, the clear seasonal pattern we’ve pointed out before still exists. That is, we have a strong start that declines through the summer, spikes for the fall “Back to School” season, and finishes strong. The trend line for each year closely mirrors the year before, with remarkably consistent weekly ups and downs. One trend that provides a bit of a silver lining in a fairly poor 24 months is that, 2009 averaged about 10-15% off of the prior year on a weekly basis, whereas in 2010 the market was about 3-6% off the prior year on a weekly basis. Could this indicate that the market has seen bottom, or are we just in a holding pattern as purchasers figure out how they want to acquire tech content? There are more selling options available now, as you will see in a later post, but the long and short of it is that many publishers are achieving more revenue and units through sales of the same content in a variety of digital formats. For some, the decline of print distribution is being offset by digital distribution and sales.
What you won’t see on this chart is that the computer book market cratered in 2001, shrinking 20 percent a year for 3 years, until it stabilized in 2004 at about half the size it was in 2000. (We only have reliable data going back to 2004.) You can now see a second cratering in the market that started in the second half of 2008 and has continued through 2010. The overall market growth rates for the previous six years are: 2005 = 1.48%; 2006 = 3.17%; 2007 = -2.00%; 2008 = -4.27%; 2009 = -15.31%; 2010 = -4.29%
So what about that market was news in 2010? In 2010, there were 11 weeks that were ahead of the prior year unit sales. In 2009, there were only two weeks that were ahead of the prior year. So from that perspective, we have seen some signs of a recovery. 2010’s overall growth finished at the market’s 2008 level and declined much more slowly than 2009. To the optimists in the crowd, it appears as though we have seen bottom — but pessimists will believe that they’ve seen this before: the market looks as though it hit bottom, but then takes another big hit downward. So it is really too unstable to predict whether it will move down again or continue to recover.
Another way to look at the market is with the Treemap visualization tool. This tool helps us pick up on trends quickly, even when looking at thousands of books. It works like this:
The size of a square shows the market share and relative size of a category, while the color shows the rate of change in sales. Red is down, and green is up, with the intensity of the color representing the magnitude of the change. The following screenshot of our treemap shows gains and losses by category, comparing the fourth quarter of 2010 with the fourth quarter of 2009.

So what are all the boxes and colors telling us? First remember that this is compares the last quarter of 2010 with the last quarter of 2009. This snapshot of the treemap looks less like the blood-bath of prior years (when there was red everywhere). There were quite a few bright spots (bright green) during the last quarter of 2010. Take a look at Android (in the upper-left box), with a 2,413% growth from the fourth quarter of 2009. You will also see Android in bright green (bottom-left corner) — the difference is that the upper-left is for consumer books and the bottom-left is for Android programming books. Both had impressive growth in 2010 compared to 2009. In the upper-left corner is iPad which is black because there were no iPad books the prior year. However it is impressive how big the box is at this early point in its evolution.
In 2010, Windows 7 was the number one growth area for units, followed by iPad, then Android (for consumers), and Android programming. This is unit growth, and a bit of the success for these technologies is that they are fairly new and do not have large market shares as a base to be measured against. Looking at longer-established technologies, Security and Network Security and Digital Photography had strong unit growth.
I find it useful to organize the trends into classifications that are High Growth Categories bright green, Moderate Growth Categories dark green to black, Categories to Watch all colors, and Down Categories red to bright red. Most of these descriptions are self-explanatory, except perhaps Categories to Watch. This group contains titles that we’ve found are not typically susceptible to seasonal swings, as well as areas on our editorial radar. If there are categories you want to get on our watch list, please let me know.
The table below highlights and explains some of the data from the chart above, although the data is for all of 2010. The Share column shows the total market share of that category, and the ROC column shows the Rate of Change (RoC = (current_period – prev_period) / prev_period). So, for example, you can see that Mac OS books represent 2.95% of the entire computer book market, and were shrinking by 32.12% (RoC).
| High Growth | Share | ROC | Notes |
| Windows 7 | 05.53% | 217.38% | A large category that has finally taken over where XP and Vista titles left off. Windows 7 is a solid leader for operating systems. |
| iPad | 01.74% | xx.yy% | This category had no 2009 presence, but is now the 7th largest category in market share. |
| Android Programming | 00.68% | 292.65% | This category has grown steadily since the end of 2008, and is now the 42nd largest book category, and has the 3rd fastest RoC. |
| Usability | 00.11% | 491.50% | This is not a huge area now, but its high RoC is accelerating its growth into a sizeable category. |
| Android | 00.55% | 2493.88% | This is the consumer area for Android — user guides, best apps, etc. Jumped from nothing in 2008, to solid growth in 2009, to top of the charts in 2010. |
| Moderate Growth | Share | ROC | Notes |
| jQuery | 00.41% | 83.79% | A good-sized category, where title output decreased from 9 titles in 2009 to 6 in 2010, yet unit sales grew steadily. |
| Cloud Computing | 00.22% | 63.58% | A growing category that saw 8 new titles make the 2010 results. Titles are mostly introductory at this point in time. |
| Windows Administration | 00.32% | 36.29% | A medium size category with 19 new titles in 2010, compared with 16 new titles in 2009 (the 2009 titles add to the units in 2010). |
| Social Web | 00.21% | 30.27% | The titles in this category have doubled in the past two years, and 2010 had the biggest growth in number of titles, at 61%. |
| Network Security | 00.90% | 24.25% | Security topics in 2010 have done well, with consistent output in the number of new titles. |
| Categories to Watch | Share | ROC | Notes |
| Office Suites | 2.71% | -3.54% | A very large category and usually consistent. Even though this category is down, it is not as down as the whole market. |
| Digital Photography | 05.97% | -17.20% | A very large category (2nd after Windows), with 4 titles selling more than 10,000 units; 10 additional new titles in 2010 produced 64,581 fewer units. |
| Spreadsheets | 02.99% | -4.66% | The third largest category, with 4 titles selling more than 10,000 units; 11 additional titles making the list in 2010 produced 8,754 fewer units than 2009. |
| Software Project Management | 02.10% | -15.14% | A good-size and consistent category, though it is down in units sold. PMP and Agile PM seem to be the most popular titles here. |
| Down Categories | Share | ROC | Notes |
| Flash | 01.12% | -84.43% | Got a bruising from Apple, and this category went into the tank, losing 59,340 in 2010 compared to 2009; In 2009, lost 55,187 units compared to 2008. |
| Mac OS | 02.95% | -32.12% | A large category with 59,668 fewer units sold in 2010. 67,642 fewer units were sold in 2009 than in 2008. Apparently Snow Leopard was a book-sales bust. |
| Web Design Tools | 01.37% | -53.20% | This category took a beating, mostly because Dreamweaver CS5 did not sell at the same pace as the CS4 titles slowed down. 45,709 fewer units were sold in 2010. |
| Web Programming | 02.01% | -41.32% | A good-size category with 16 fewer titles contributing to the category in 2010. In 2009, this category saw 56 titles selling more than 1,000 units, compared to 37 titles in 2010. |
| Web Page Creation | 04.09% | -27.37% | A large category with only 4 titles producing more than 10,000 units in 2010 whereas 7 titles in 2009 hit that mark. There were 70,492 fewer units sold in 2010. |
Post 2 in this series will provide a closer look at the technologies within the categories. Post 3 will be about the publishers, both winners and losers. Post 4 will contain more analysis of programming languages, and Post 5 will look at digital sales.